
Many marketers measure LinkedIn success by follower count, but that metric misses the mark. True performance hinges on engagement rate calculated from impressions, which reveals how effectively your content resonates with actual viewers. Understanding this distinction is essential for B2B marketers aiming to optimize campaigns, boost visibility, and generate qualified leads on LinkedIn in 2026.
Table of Contents
- Understanding LinkedIn Engagement Rate: Definition And Importance
- How To Calculate LinkedIn Engagement Rate: Formulas And Best Practices
- LinkedIn Engagement Benchmarks For 2026: Industries And Follower Count
- Content Types, Posting Frequency, And Sources Impacting Engagement
- Common Misconceptions And Correct Interpretations Of LinkedIn Engagement Rate
- Practical Strategies To Improve Your LinkedIn Engagement Rate
- Using Engagement Rate To Optimize LinkedIn Marketing Campaigns
- Elevate Your LinkedIn Marketing With Kawaak
- Frequently Asked Questions
Key takeaways
| Point | Details |
|---|---|
| Engagement rate measures interactions relative to impressions, not follower count | This approach reflects actual content reach and provides actionable insights for optimization |
| Effective content formats include multi-image and native documents for higher engagement | Multi-image posts average 6.6% engagement, significantly outperforming text-only content |
| Employee advocacy drives 5 to 10 times more engagement than brand content on LinkedIn | Authentic personal posts expand reach and build trust with professional audiences |
| 2026 benchmarks vary by industry and follower size, guiding realistic goal setting | Smaller accounts typically achieve 5 to 12% engagement while larger pages average 1 to 3% |
| Accurate calculation empowers optimization for better reach and lead generation | Impressions-based formulas align with LinkedIn analytics and deliver meaningful performance data |
Understanding LinkedIn engagement rate: definition and importance
LinkedIn engagement rate reflects not just vanity metrics, but actionable insights into reach, prospect warmth, and algorithmic distribution essential for outbound sales and lead generation campaigns. This metric measures the total interactions your content receives relative to how many people actually saw it, providing a clear picture of content resonance.
Engagement encompasses multiple interaction types that capture audience interest depth:
- Reactions like likes and celebrates show immediate approval
- Comments indicate deeper involvement and conversation willingness
- Shares amplify your message to new networks
- Clicks on links or media demonstrate intent to learn more
LinkedIn’s algorithm prioritizes content with higher engagement rates, creating a compounding effect. Posts that generate strong early engagement receive broader organic distribution, appearing in more feeds and gaining additional visibility. This algorithmic boost makes engagement rate a critical lever for expanding reach without paid promotion.
For B2B marketers, engagement rate directly impacts lead generation effectiveness and sales outreach success. High engagement signals content relevance to your target audience, warming prospects before direct contact. When you align marketing goals on LinkedIn with engagement optimization, you create sustainable pathways for relationship building and conversion.
The key distinction lies in using impressions rather than follower count as the denominator. Impressions represent actual views, while follower count assumes everyone sees every post. This difference fundamentally changes how you interpret performance and make strategic decisions.
How to calculate LinkedIn engagement rate: formulas and best practices
The impressions-based formula provides the most accurate engagement rate calculation: (Reactions + Comments + Shares + Clicks) ÷ Impressions × 100. This method reflects engagement relative to actual content reach rather than follower count, giving you a true performance snapshot.
The follower-based formula (Total engagements ÷ follower count × 100) often underestimates true engagement because it assumes all followers see every post. LinkedIn’s feed algorithm shows content selectively based on relevance and user behavior, meaning many followers never see your updates. Using follower count as the baseline creates artificially low percentages that don’t reflect real audience response.
Follow these steps to calculate engagement rate accurately:
- Access LinkedIn analytics for your post or page
- Record total impressions from the analytics dashboard
- Sum all engagement actions: reactions, comments, shares, and clicks
- Divide total engagements by impressions
- Multiply by 100 to get the percentage
LinkedIn native analytics provides the most reliable data for these calculations. Company page admins can access detailed metrics through the analytics tab, while individual profiles receive post-specific data. Third-party tools may offer additional insights, but always verify against LinkedIn’s official numbers for accuracy.
Pro Tip: Calculate engagement rates for individual posts rather than averages across all content to identify which topics and formats resonate most with your audience, then double down on what works.
Common pitfalls include mixing organic and paid impressions without separating them, counting the same user multiple times if they engage repeatedly, and comparing rates across vastly different time periods when algorithm changes may have occurred. Keep your measurements consistent and contextualized to maintain reliable tracking that supports measuring LinkedIn ROI success.
LinkedIn engagement benchmarks for 2026: industries and follower count
Engagement rates show an inverse correlation with follower count. Smaller accounts typically achieve higher percentage engagement because their audiences are more tightly connected and invested. As follower counts grow, engagement rates naturally decrease, making context essential when evaluating performance.

Personal profiles consistently outperform company pages in engagement metrics. Individual posts benefit from authentic voice and established relationships, while corporate content often feels more promotional. This gap highlights the strategic value of employee advocacy programs.
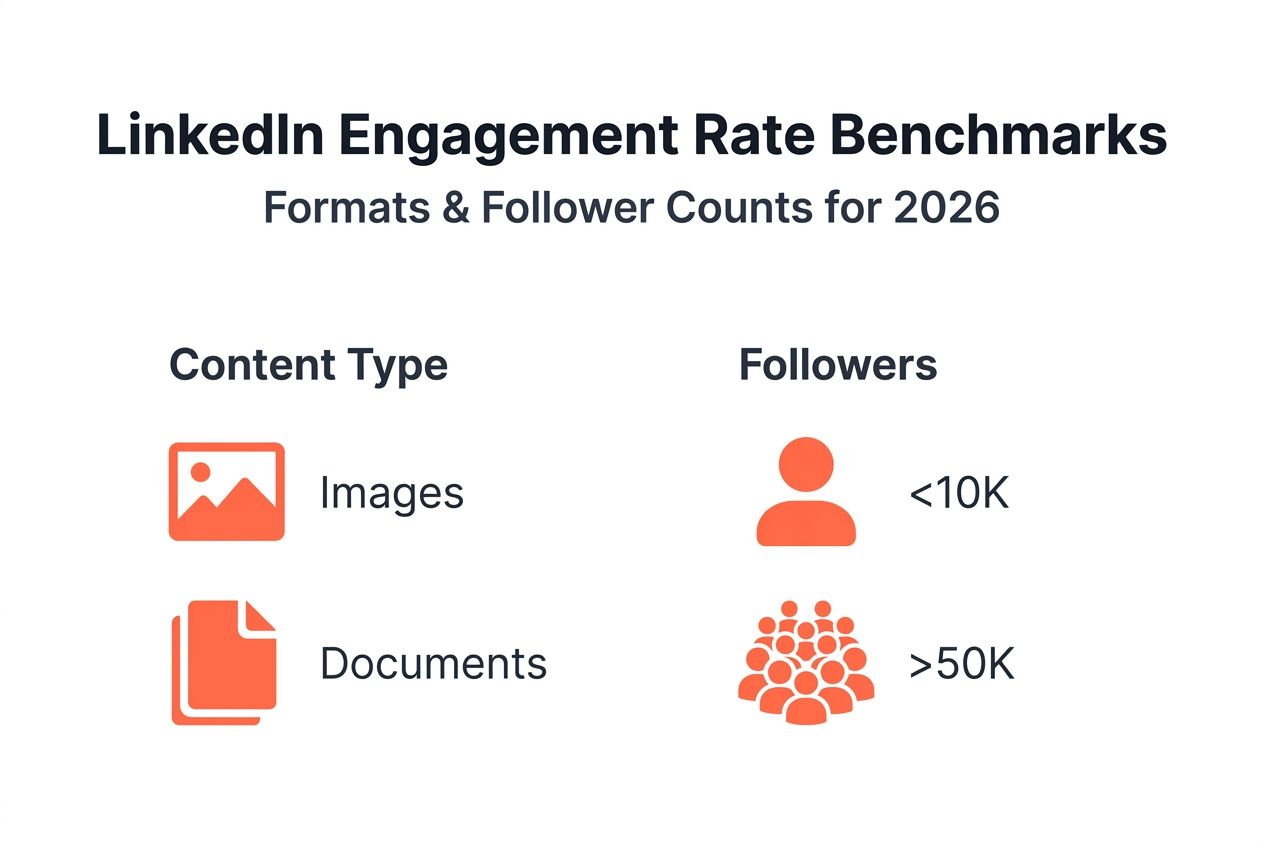
Industry benchmarks for 2026 reveal significant variation:
| Industry Sector | Average Engagement Rate | Notes |
|---|---|---|
| B2B Technology | 3.6% | Higher rates reflect content relevance to professional audiences |
| Retail | 3.9% | Strong visual content drives engagement |
| Professional Services | 3.2% | Thought leadership resonates with decision makers |
| Manufacturing | 2.8% | Niche audiences engage deeply with technical content |
Follower count ranges show distinct performance patterns:
- Accounts under 1,000 followers: 5 to 12% engagement
- Accounts with 1,000 to 10,000 followers: 3 to 7% engagement
- Accounts with 10,000 to 100,000 followers: 1.5 to 4% engagement
- Accounts over 100,000 followers: 1 to 3% engagement
These benchmarks help you set realistic objectives rather than chasing arbitrary targets. If your company page has 50,000 followers and achieves 2.5% engagement, you’re performing well within industry norms. Understanding where you stand enables better resource allocation and strategy refinement.
Use benchmarks to evaluate ROI by comparing your performance against similar organizations. Significant underperformance signals content misalignment with audience interests, while exceeding benchmarks validates your approach. This context proves invaluable when you master LinkedIn influencer vetting for B2B ROI and need to assess potential partner performance.
Content types, posting frequency, and sources impacting engagement
Content format critically influences engagement outcomes. Multi-image posts average 6.6%, native documents 6.1%, and videos 5.6% engagement, outperforming text-only posts significantly. These formats provide visual variety and multiple touchpoints that capture attention in crowded feeds.
| Content Format | Average Engagement Rate | Best Use Case |
|---|---|---|
| Multi-image posts | 6.6% | Showcasing processes, before/after comparisons, step-by-step guides |
| Native documents | 6.1% | Sharing comprehensive resources, reports, frameworks |
| Videos | 5.6% | Demonstrating products, sharing customer stories, explaining concepts |
| Text-only posts | 4.2% | Quick insights, thought-provoking questions, timely commentary |
Posting frequency impacts engagement differently based on company size and audience expectations. Smaller organizations can maintain higher engagement with 3 to 5 posts weekly, while larger enterprises may post daily without diminishing returns. The key lies in balancing volume with quality, ensuring each post delivers genuine value.
Employee-shared posts outperform brand pages by 5 to 10 times in engagement rates, highlighting the value of authentic, personal content in B2B marketing. When employees share company updates through their networks, the content reaches warmer audiences already predisposed to trust the messenger. This network effect expands reach exponentially compared to company page posts alone.
Authentic storytelling drives deeper engagement than promotional messaging. Posts that share genuine challenges, lessons learned, or behind-the-scenes insights spark conversations and comments. Audiences respond to vulnerability and real experiences, not polished corporate speak.
Pro Tip: Create an employee advocacy program that empowers team members to share content in their authentic voice rather than mandating exact copy, which preserves the personal touch that drives higher engagement.
Optimal posting cadence varies by audience size:
- Small audiences (under 5,000): 3 to 4 posts per week
- Medium audiences (5,000 to 50,000): 4 to 7 posts per week
- Large audiences (over 50,000): 5 to 10 posts per week
Monitor engagement patterns when you master LinkedIn workflow for marketing success to identify when your specific audience is most active and receptive.
Common misconceptions and correct interpretations of LinkedIn engagement rate
Many marketers mistakenly believe follower-based engagement rate is the best measure, but impressions-based calculation is more accurate as it reflects actual content reach. This fundamental misunderstanding leads to flawed strategy decisions and misallocated resources.
Another widespread misconception limits engagement to likes alone. True engagement encompasses multiple interaction types:
- Likes and reactions show immediate approval
- Comments indicate willingness to invest time in conversation
- Shares amplify reach to new networks
- Clicks demonstrate interest in learning more
Ignoring comments, shares, and clicks undervalues content that sparks meaningful dialogue or drives traffic to resources.
Some view engagement metrics as vanity measures disconnected from business outcomes. This perspective misses how engagement directly influences content distribution, lead generation, and marketing ROI. Higher engagement rates trigger algorithmic amplification, expanding organic reach to potential customers. Engaged audiences are warmer prospects for sales outreach, having already demonstrated interest through their interactions.
The belief that all engagement holds equal value overlooks quality differences. A thoughtful comment from a decision maker at a target account carries more strategic value than a dozen likes from unqualified connections. Weight engagement based on source authority and relevance to business goals.
Misinterpreting benchmark comparisons leads to unrealistic expectations. Comparing a 100,000-follower company page to a 500-follower personal profile creates false performance narratives. Context matters: evaluate your metrics against similar account types, industries, and follower ranges.
Understanding these distinctions ensures you correctly interpret engagement data and make informed decisions. When you grasp the nuances, you can leverage LinkedIn marketing benefits in 2026 to drive measurable business results rather than chasing misleading metrics.
Practical strategies to improve your LinkedIn engagement rate
Authentic storytelling and employee advocacy significantly boost engagement by leveraging personal networks and genuine voices. Encourage team members to share insights, experiences, and company updates through their profiles to multiply reach and credibility.
Implement these proven tactics to elevate engagement:
- Create multi-image posts that showcase processes, comparisons, or step-by-step guides to capture visual attention
- Upload native documents like reports or frameworks directly to LinkedIn for higher engagement than external links
- Share videos demonstrating products, customer success stories, or explaining complex concepts in digestible formats
- Post during peak activity hours when your target audience actively browses LinkedIn feeds
- Ask specific questions that invite thoughtful responses rather than yes/no answers
- Respond promptly to comments to encourage ongoing conversation and signal active engagement
Tailor posting frequency to your audience size and capacity for quality content creation. Smaller organizations should focus on 3 to 5 high-value posts weekly rather than daily mediocre updates. Quality consistently outperforms quantity in driving meaningful engagement.
Continually monitor engagement metrics to identify patterns and opportunities. Track which topics, formats, and posting times generate strongest responses, then refine your content calendar accordingly. This data-driven approach replaces guesswork with evidence-based optimization.
Pro Tip: Analyze your top 10 performing posts from the past quarter to identify common themes, formats, and messaging approaches, then create a repeatable framework based on these proven elements.
Integrate influencer partnerships to amplify reach and credibility. When you master LinkedIn influencer vetting for B2B ROI, you identify creators whose audiences align with your target market. Collaborating with these influencers expands your content’s reach to engaged, relevant networks.
Develop strong personal branding on LinkedIn for executives and thought leaders within your organization. When leadership shares insights and engages authentically, it humanizes your brand and drives higher engagement than corporate messaging alone.
Apply LinkedIn outreach best practices to warm up prospects through valuable content before direct sales contact. High engagement rates signal content-market fit and create natural conversation starters for outreach.
Using engagement rate to optimize LinkedIn marketing campaigns
Engagement rate serves as a north star metric for LinkedIn marketing success, directly correlating with organic reach and audience warmth. When you master accurate measurement using the impressions-based formula, you unlock deeper insights into what content resonates and why.
This understanding transforms how you allocate resources and design campaigns. Instead of creating content based on assumptions, you make data-driven decisions backed by clear performance indicators. Higher engagement rates signal strong content-market fit, validating your messaging and topic selection.
Benchmarks provide essential context for evaluating performance and setting realistic goals. Knowing where you stand relative to similar organizations in your industry helps you identify improvement opportunities and celebrate meaningful wins. This contextualized view prevents chasing arbitrary targets that don’t align with your specific situation.
Consistent monitoring and iteration separate good LinkedIn marketing from great campaigns. By tracking engagement rates over time, you spot trends, test hypotheses, and refine your approach based on evidence. This continuous improvement mindset ensures your strategy evolves with audience preferences and platform changes.
The strategic advantage comes from connecting engagement insights to broader business objectives. High engagement rates expand reach, warm prospects, and create pathways for relationship building that fuel lead generation and revenue growth. When you view engagement through this lens, it becomes a powerful tool for driving measurable business impact.
Elevate your LinkedIn marketing with Kawaak
Understanding LinkedIn engagement rate is just the beginning. Kawaak connects B2B brands with verified LinkedIn creators to amplify your campaigns through authentic influencer partnerships. Our platform streamlines the entire process, from identifying ideal creator matches to managing LinkedIn campaigns that drive measurable engagement and ROI.
Whether you’re ready to launch B2B LinkedIn influence campaigns or want to transform your LinkedIn expertise into authority, Kawaak provides the tools and network to maximize your impact. Join brands and creators who are redefining B2B marketing on LinkedIn through data-backed influencer collaborations that deliver real business results.
Frequently asked questions
What is considered a good LinkedIn engagement rate in 2026?
Good engagement rates vary by follower count and industry but generally range from 1 to 3% for large pages and 5 to 12% for smaller accounts in 2026. Personal profiles typically achieve higher engagement than company pages due to authentic connections and trusted relationships. Use industry-specific benchmarks to set realistic goals that account for your specific context and audience size.
Why is the impressions-based formula preferred over follower-based for engagement rate?
Impressions-based calculation measures engagement relative to actual content reach, accounting for how many people saw the post rather than assuming all followers view every update. Follower-based calculation often underestimates true engagement because LinkedIn’s algorithm shows content selectively based on relevance and user behavior. The impressions-based formula aligns with LinkedIn native analytics and provides more actionable insights for optimization.
How can employee advocacy amplify LinkedIn engagement rates?
Employee advocacy posts generate 5 to 10 times more engagement than brand-only posts due to authenticity and network effects that expand reach exponentially. When employees share content through their personal profiles, it reaches warmer audiences already predisposed to trust the messenger. Incorporating employee advocacy is a data-backed strategy to boost LinkedIn campaign performance while humanizing your brand and building genuine relationships with professional audiences.
How often should I post on LinkedIn to maintain strong engagement?
Posting frequency depends on your audience size and content quality capacity. Smaller organizations with under 5,000 followers should focus on 3 to 4 high-value posts weekly, while larger enterprises can post 5 to 10 times per week. Quality consistently outperforms quantity, so prioritize valuable content over arbitrary posting schedules that dilute your message.
Recommended
- LinkedIn Marketing Benefits 2026: 80% B2B Leads & 2x CVR – Kawaak
- LinkedIn Outreach Best Practices: 312% Higher Responses – Kawaak
- How to align marketing goals on LinkedIn: 520% ROI guide 2026 – Kawaak
- Master your LinkedIn workflow for marketing success in 2026 – Kawaak
- LinkedIn Newsletter – Naro Law